
Every month the WLCG reports on the performance of all T1 sites and T2 sites, showing how much “computing power” each site has delivered to the CMS experiment. This report is also stored in a database directly accessible at the CRIC page. The delivered “computing power” is measured as the active core hours at the given site(s) multiplied by the average computing power per core for the given site(s).
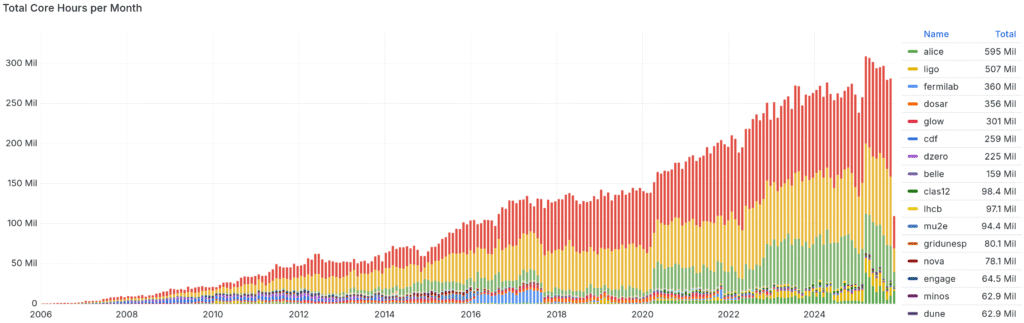
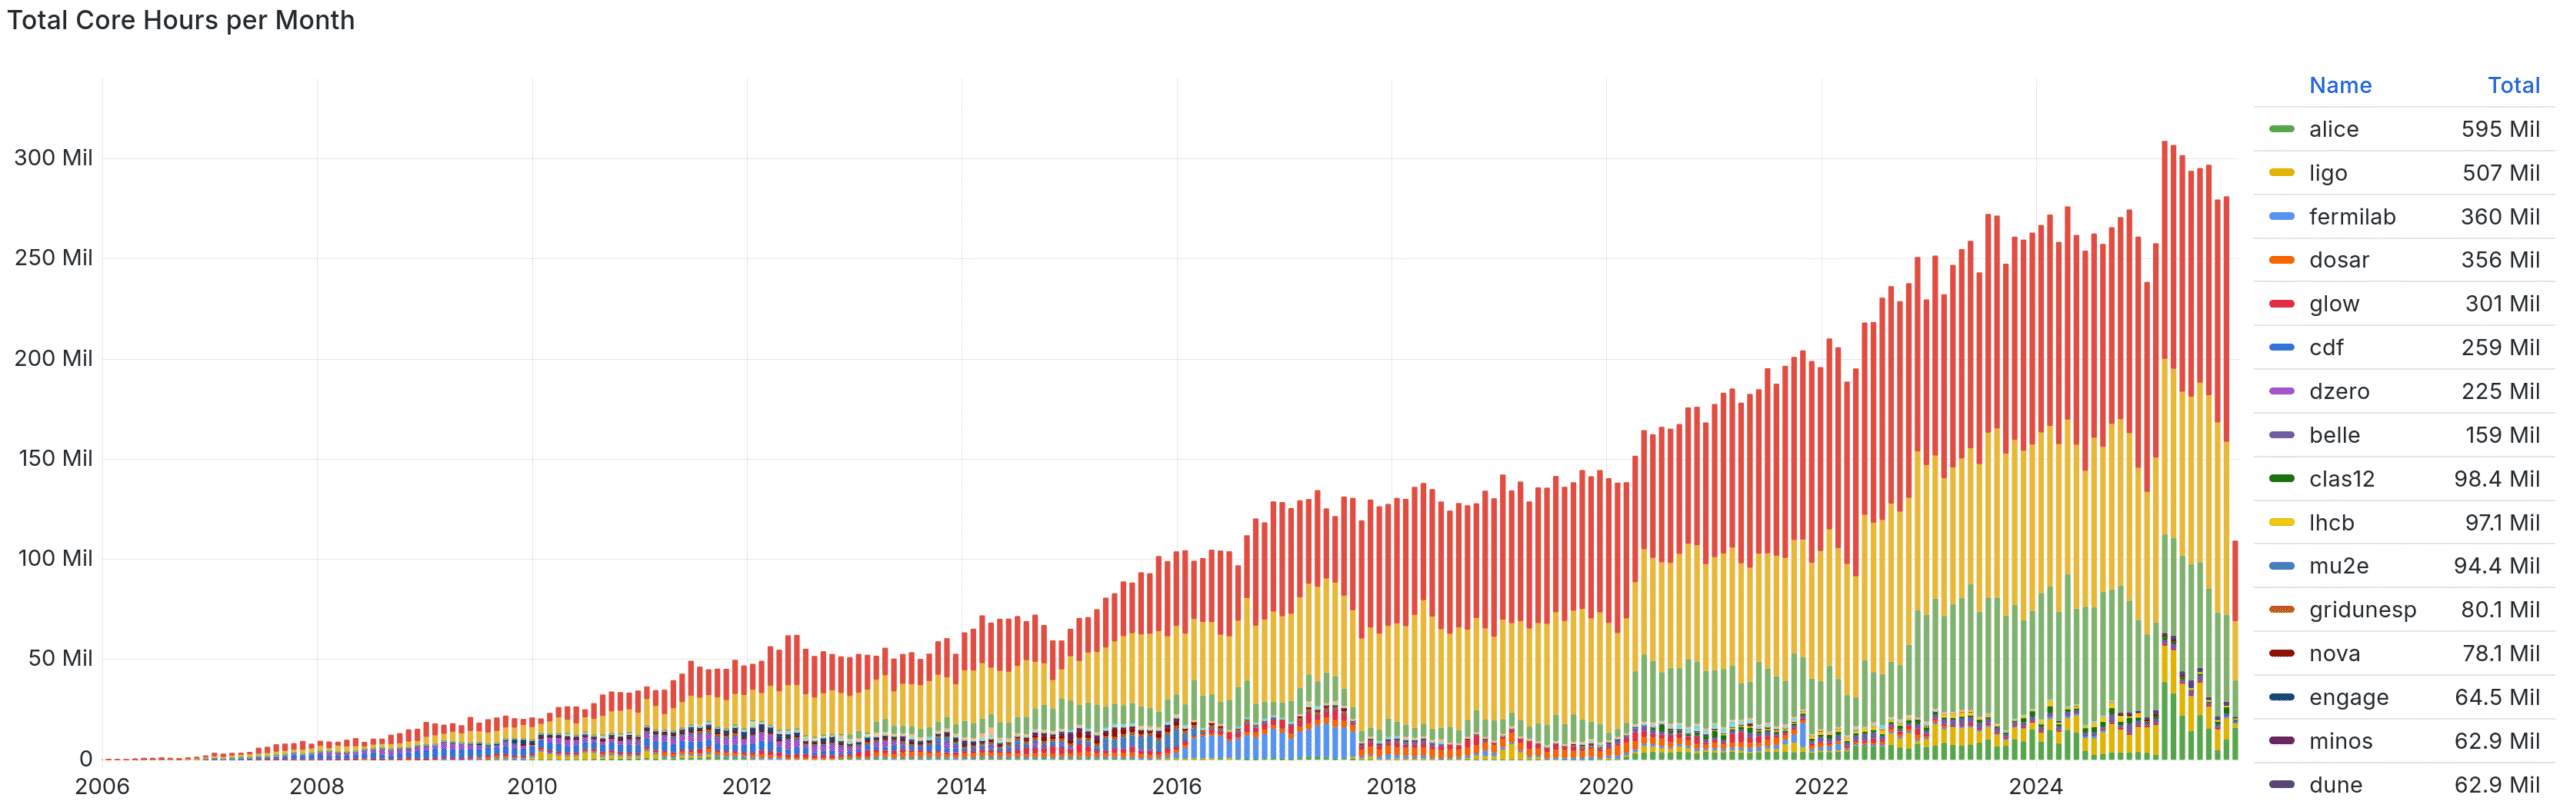
The active core hours per site are stored at this GRACC page (ex. MIT, Wisconsin). It is important to note that the reported delivered core hours are taken from the pilot jobs that are submitted to implement a late binding scheme. So, it is possible that a site runs zero payload in the pilot or runs them with very low efficiency, but the recorded time counts 100%. As a development project it would be interesting to subtract the idle time of the pilots. If one is really interested in the raw computing time it would make sense to also multiply the time spent with the efficiency. It is less obvious that this is desirable, because some workflows are inherently more efficient than others, for example fast reprocessing might be IO limited while heavy Monte Carlo generation will be more likely CPU limited.
The average computing power per core for a given computing server is determined by benchmarks of that server architecture and is measured in units of HEPSpec (HepSpec23, or HS23 is the 2023 version of the HEP spec). The average computing power per core for the given site that is used in the report is taken from this yaml pages. In this page every site declares the average HS23 number for every Computing Element (CE) at a given site. The metric has a somewhat complex name and is called the APELNormalFactor. We, MIT_CMS and some other sites, report that number to be the same for each CE. Some sites, like Purdue, have a more complex topology and report multiple CEs with different average HS23 metrices.
The current report numbers can be reproduced by using this script. For sites like Purdue the script just takes an average between all CEs and that is the number used as average HS23. No attempt is made to trace how much a particular CE contributed to CMS. There is an ongoing effort by OSG to trace each CE contribution by introducing another variable called HEPScore23Percentage into the CRIC reports. Our site, does not have that variable in the topology settings at the moment.
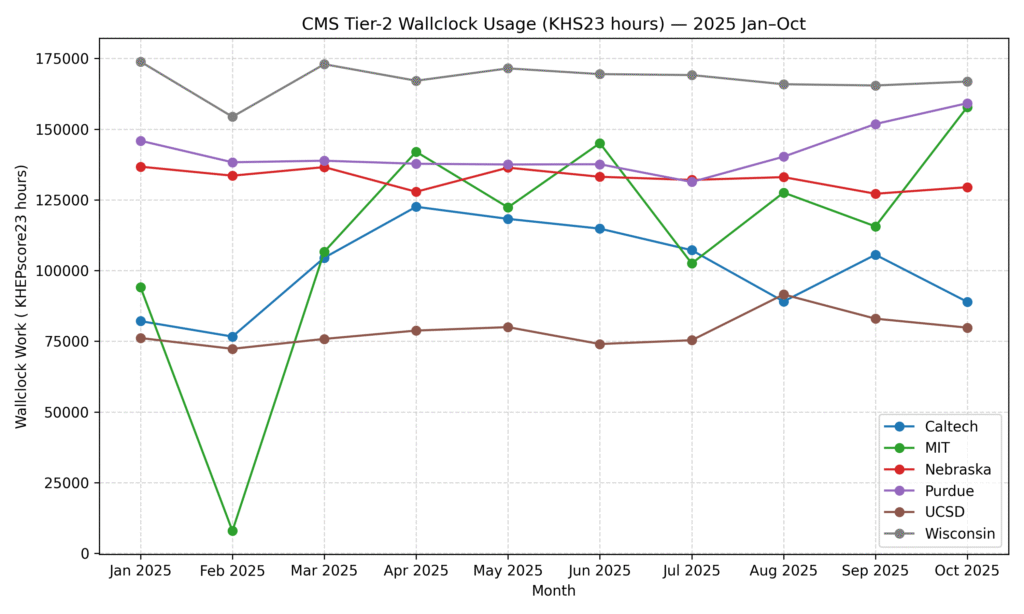
The WLCG reporting shown for the U.S. Tier-2 Computing Centers.
The MIT performance in the last year have been fluctuating, in particular in the beginning of the year when we had a long downtime due to the chiller update of the computing center and because of our transition from an HDFS to a CephFS storage system. The following commissioning has introduced some variability in the performance but we should be back to stable running now.
Miscellanea: – it is not clear how to reproduce older numbers if a site changed the APELNormalFactor or HEPScore23Percentage. The average HS23 numbers for the MIT Tier-2 site in the yaml file when inspected, were outdated and lower than what they really should have been. This has been corrected mid-November 2025.